Approaches to Disaster Prevention using Space Technology Application of Satellite Remote Sensing Technology - Satellite Disaster Prevention Information Service
Release:
Update:
NEW
CHALLENGE
Limits of Visual Inspection
In recent years, Japan has been facing the aging of a vast number of infrastructure facilities built during the period of rapid economic growth, as well as increasingly severe natural disasters. There is a growing need for more efficient and comprehensive management of infrastructure facilities, as well as rapid assessment of damages and prompt recovery after a disaster. However, with the shortage of engineers and manpower, it is not safe or cost-effective to inspect and manage all infrastructure facilities by human effort.
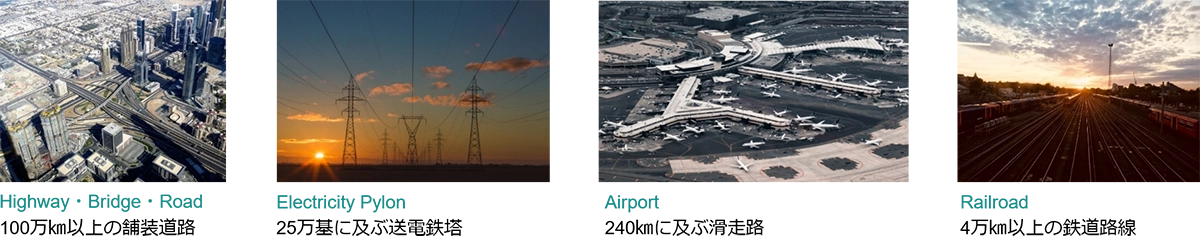
For example, the management of large-scale infrastructure facilities such as roads, railroads, and airports require a huge amount of labor for inspection, and the efficiency of inspection work is an issue for transmission towers located in mountainous areas. The cost of inspecting and maintaining infrastructure facilities in Japan under laws and regulations and technical standards is estimated to be as much as 625 billion yen* per year, and the substantial cost amount is becoming a big concern. In the event of a disaster, such as a huge typhoon or torrential rain, flooding can occur over a wide area, thus making it extremely difficult to assess the extent of the damage from helicopters and sites observation alone.
With the declining birthrate, aging population, and decreasing number of engineers, the human burden in maintaining and managing infrastructure facilities and responding to wide-area disasters is expected to increase further in the future. In response to this situation, the efficiency of infrastructure facility management and damage assessment is expected to be improved by utilizing satellite remote sensing technology that can observe a wide area at once.
- *Source: 2020 Edition, Current Status and Future Prospects of the Next-Generation Infrastructure Maintenance Management Technology and System Related Market, Fuji Keizai Co., Ltd.
SOLUTION
Application of Satellite Remote Sensing Technology - Satellite Disaster Prevention Information Service
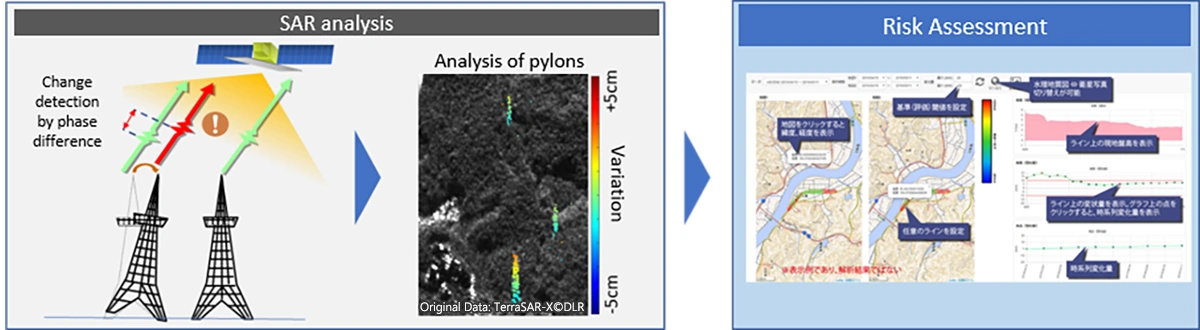
In addition to optical satellites, which can acquire color images like aerial photographs, data obtained by radar satellites called synthetic-aperture radar (SAR) satellites are used to monitor minute changes in infrastructure. This is called SAR interferometric analysis. Time series interferometric analysis, in which multiple interferometric analyses are performed, is suitable for long-term monitoring of the displacement of infrastructure facilities. There is a wide range of infrastructure facilities to be observed, such as airports, ports, dams, levees, pylons and roads, and it is effective when applied to large-scale facilities and those that are difficult for people to access. In addition to structures, continuous monitoring of mountain slopes can be used to detect changes and prevent slope disasters such as landslides.
In the Satellite Disaster Information Service (SADIS), which we released jointly with SKY Perfect JSAT and Zenrin in April 2021, we are developing a service to assess the degree of danger of infrastructure facilities and slopes by identifying areas that have changed over time through wide-area satellite observations and combining this with Nippon Koei's know-how* in the fields of civil engineering and disaster prevention.
The service also provides information on disaster damages in the event of a disaster. Based on data acquired by multiple satellites, the service can detect areas of flooding and landslide collapse that occur over a wide area, contributing to the rapid assessment of damage.
- *For examples of Nippon Koei's technological know-how in civil engineering and disaster prevention", please refer to https://www.n-koei.co.jp/consulting/english/service/.
RESULT
Infrastructure Monitoring
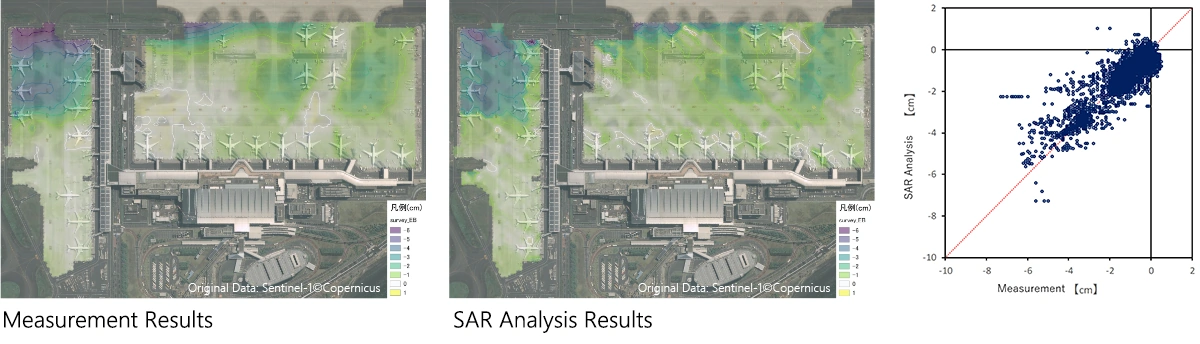
We used the international apron of Haneda Airport (where aircrafts are parked) as a field for comparison and verification between existing survey results and the SAR time-series interferometric analysis results.
The left figure shows the amount of fluctuation over two years calculated from the survey results, and the right figure shows the amount of fluctuation over two years calculated by SAR time-series interferometric analysis. Both the survey results and the SAR analysis results show a large sinking trend in the upper left part of the apron, and the overall fluctuation trend is generally consistent. When the SAR data scattered in the apron were averaged according to the location of the survey points and the errors were compared, the absolute error mean was 0.42 cm and the RMSE* was 0.61 cm, indicating a high degree of agreement with the survey results. In this verification, data from Sentinel-1 was used, which is available free of charge. Verification using commercial SAR satellites with higher resolution is continuing, and we are working to apply this technology to various sectors.
- *Mean square error: The smaller the value, the more consistent the trend of variation with the surveyed value. Compared to the mean error, this indicator is more sensitive to data with large errors.
Disaster Situation Monitoring
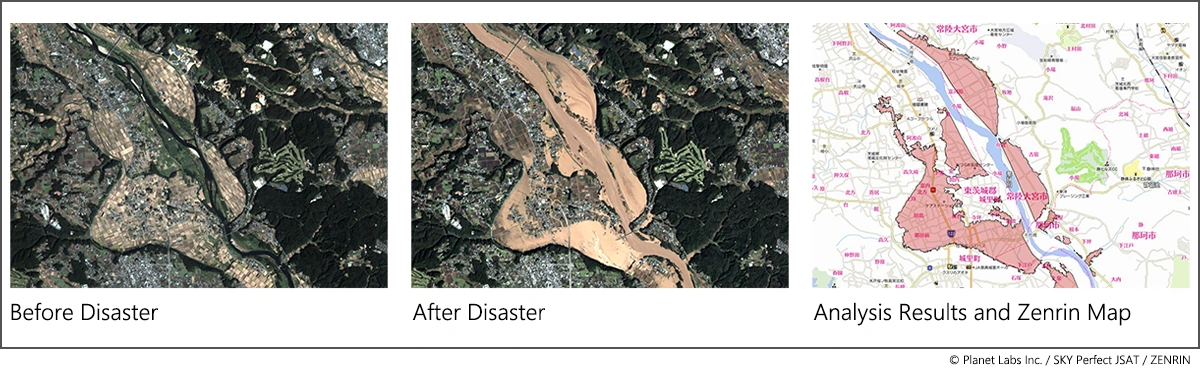
The following results were obtained by automatically analyzing the inundation area using satellite images of the Naka River taken during the East Japan Typhoon in 2019. The area circled in red is the inundation area extracted by the analysis, and it can be seen that the analysis accurately detected the brownish muddy water area caused by floodwaters. Furthermore, by overlaying the extracted results with Zenrin's detailed maps, we can provide information such as the number of flooded buildings.
In the future, satellite images with local SNS information will be combined to build a faster and more accurate inundation estimation technology.